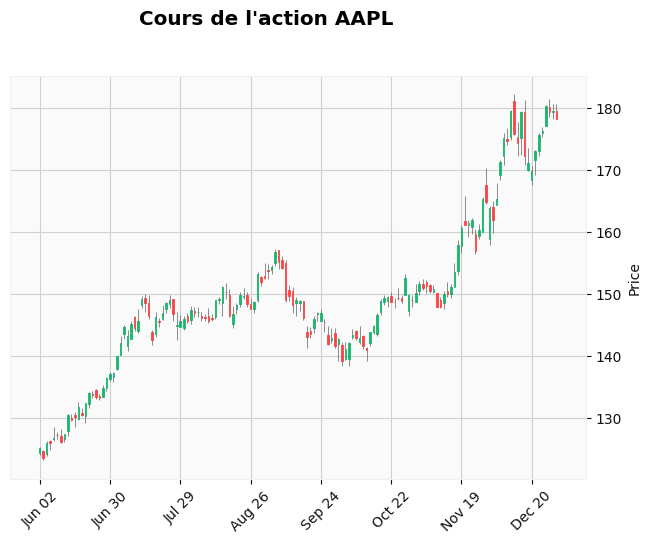
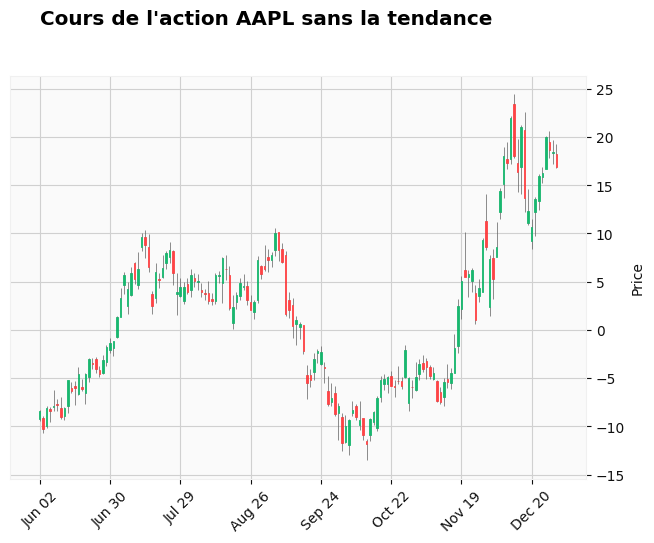
How detrended data behave with candlestick chart#
The whole data are detrended using close price (chosen arbitrarily amongst open / close / high / low).
This way, the detrended data can be plotted on candlestick chart.
Otherwise, open / close / high / low prices may cross each other.
1import mplfinance as mpl
2import pandas as pd
3
4from src.utils.misc import init_notebook
1init_notebook()
Choose detrend method
1detrend_model_name = "LinearMADetrend"
2model_options = "window-100"
1raw_data_folder = "data/raw"
2processed_data_folder = (
3    f"data/processed_data/detrend_data/{detrend_model_name}/{model_options}"
4)
5stock_name = "AAPL"
 1df = pd.read_csv(
 2    f"{raw_data_folder}/{stock_name}.csv", parse_dates=["Date"], index_col="Date"
 3)
 4print(f"{df.shape = }")
 5
 6df_detrend = pd.read_csv(
 7    f"{processed_data_folder}/{stock_name}.csv",
 8    parse_dates=["Date"],
 9    index_col="Date",
10)
df.shape = (756, 6)
---------------------------------------------------------------------------
FileNotFoundError                         Traceback (most recent call last)
Cell In[5], line 6
      1 df = pd.read_csv(
      2     f"{raw_data_folder}/{stock_name}.csv", parse_dates=["Date"], index_col="Date"
      3 )
      4 print(f"{df.shape = }")
----> 6 df_detrend = pd.read_csv(
      7     f"{processed_data_folder}/{stock_name}.csv",
      8     parse_dates=["Date"],
      9     index_col="Date",
     10 )

File ~/work/stock-analysis/stock-analysis/.venv/lib/python3.13/site-packages/pandas/io/parsers/readers.py:1026, in read_csv(filepath_or_buffer, sep, delimiter, header, names, index_col, usecols, dtype, engine, converters, true_values, false_values, skipinitialspace, skiprows, skipfooter, nrows, na_values, keep_default_na, na_filter, verbose, skip_blank_lines, parse_dates, infer_datetime_format, keep_date_col, date_parser, date_format, dayfirst, cache_dates, iterator, chunksize, compression, thousands, decimal, lineterminator, quotechar, quoting, doublequote, escapechar, comment, encoding, encoding_errors, dialect, on_bad_lines, delim_whitespace, low_memory, memory_map, float_precision, storage_options, dtype_backend)
   1013 kwds_defaults = _refine_defaults_read(
   1014     dialect,
   1015     delimiter,
   (...)   1022     dtype_backend=dtype_backend,
   1023 )
   1024 kwds.update(kwds_defaults)
-> 1026 return _read(filepath_or_buffer, kwds)

File ~/work/stock-analysis/stock-analysis/.venv/lib/python3.13/site-packages/pandas/io/parsers/readers.py:620, in _read(filepath_or_buffer, kwds)
    617 _validate_names(kwds.get("names", None))
    619 # Create the parser.
--> 620 parser = TextFileReader(filepath_or_buffer, **kwds)
    622 if chunksize or iterator:
    623     return parser

File ~/work/stock-analysis/stock-analysis/.venv/lib/python3.13/site-packages/pandas/io/parsers/readers.py:1620, in TextFileReader.__init__(self, f, engine, **kwds)
   1617     self.options["has_index_names"] = kwds["has_index_names"]
   1619 self.handles: IOHandles | None = None
-> 1620 self._engine = self._make_engine(f, self.engine)

File ~/work/stock-analysis/stock-analysis/.venv/lib/python3.13/site-packages/pandas/io/parsers/readers.py:1880, in TextFileReader._make_engine(self, f, engine)
   1878     if "b" not in mode:
   1879         mode += "b"
-> 1880 self.handles = get_handle(
   1881     f,
   1882     mode,
   1883     encoding=self.options.get("encoding", None),
   1884     compression=self.options.get("compression", None),
   1885     memory_map=self.options.get("memory_map", False),
   1886     is_text=is_text,
   1887     errors=self.options.get("encoding_errors", "strict"),
   1888     storage_options=self.options.get("storage_options", None),
   1889 )
   1890 assert self.handles is not None
   1891 f = self.handles.handle

File ~/work/stock-analysis/stock-analysis/.venv/lib/python3.13/site-packages/pandas/io/common.py:873, in get_handle(path_or_buf, mode, encoding, compression, memory_map, is_text, errors, storage_options)
    868 elif isinstance(handle, str):
    869     # Check whether the filename is to be opened in binary mode.
    870     # Binary mode does not support 'encoding' and 'newline'.
    871     if ioargs.encoding and "b" not in ioargs.mode:
    872         # Encoding
--> 873         handle = open(
    874             handle,
    875             ioargs.mode,
    876             encoding=ioargs.encoding,
    877             errors=errors,
    878             newline="",
    879         )
    880     else:
    881         # Binary mode
    882         handle = open(handle, ioargs.mode)

FileNotFoundError: [Errno 2] No such file or directory: 'data/processed_data/detrend_data/LinearMADetrend/window-100/AAPL.csv'
1df_6_months = df[df.index > pd.Timestamp("2021-06-01")]
2df_detrend_6_months = df_detrend[df.index > pd.Timestamp("2021-06-01")]
 1mpl.plot(
 2    df_6_months,
 3    type="candle",
 4    title=f"Cours de l'action {stock_name}",
 5    style="yahoo",
 6)
 7mpl.plot(
 8    df_detrend_6_months,
 9    type="candle",
10    title=f"Cours de l'action {stock_name} sans la tendance",
11    style="yahoo",
12)

