Visualisation#
Import des outils / jeu de données#
1import matplotlib.pyplot as plt
2import pandas as pd
3import seaborn as sns
4
5from src.config import data_folder
6from src.constants import var_categoriques, var_numeriques
7from src.utils import init_notebook
1init_notebook()
1df = pd.read_csv(
2    f"{data_folder}/data-cleaned-feature-engineering.csv",
3    sep=",",
4    index_col="ID",
5    parse_dates=True,
6)
1df.head()
| Year_Birth | Education | Marital_Status | Income | Kidhome | Teenhome | Dt_Customer | Recency | MntWines | MntFruits | ... | NumWebVisitsMonth | AcceptedCmp3 | AcceptedCmp4 | AcceptedCmp5 | AcceptedCmp1 | AcceptedCmp2 | Response | NbAcceptedCampaigns | HasAcceptedCampaigns | NbChildren | |
|---|---|---|---|---|---|---|---|---|---|---|---|---|---|---|---|---|---|---|---|---|---|
| ID | |||||||||||||||||||||
| 5524 | 1957 | Graduation | Single | 58138.0 | 0 | 0 | 2012-09-04 | 58 | 635 | 88 | ... | 7 | 0 | 0 | 0 | 0 | 0 | 1 | 0 | False | 0 |
| 2174 | 1954 | Graduation | Single | 46344.0 | 1 | 1 | 2014-03-08 | 38 | 11 | 1 | ... | 5 | 0 | 0 | 0 | 0 | 0 | 0 | 0 | False | 2 |
| 4141 | 1965 | Graduation | Together | 71613.0 | 0 | 0 | 2013-08-21 | 26 | 426 | 49 | ... | 4 | 0 | 0 | 0 | 0 | 0 | 0 | 0 | False | 0 |
| 6182 | 1984 | Graduation | Together | 26646.0 | 1 | 0 | 2014-02-10 | 26 | 11 | 4 | ... | 6 | 0 | 0 | 0 | 0 | 0 | 0 | 0 | False | 1 |
| 5324 | 1981 | PhD | Married | 58293.0 | 1 | 0 | 2014-01-19 | 94 | 173 | 43 | ... | 5 | 0 | 0 | 0 | 0 | 0 | 0 | 0 | False | 1 |
5 rows × 28 columns
Variables globales#
1var_categoriques_extra = ["NbAcceptedCampaigns", "HasAcceptedCampaigns", "NbChildren"]
2
3var_categoriques_fe = (
4    var_categoriques + var_categoriques_extra
5)  ## todo: sauvegarder toutes ces listes dans un pd.Series et les lire
1df[var_categoriques_fe] = df[var_categoriques_fe].astype(str).astype("category")
Visualisation#
Relation avec la variable cible (Response)#
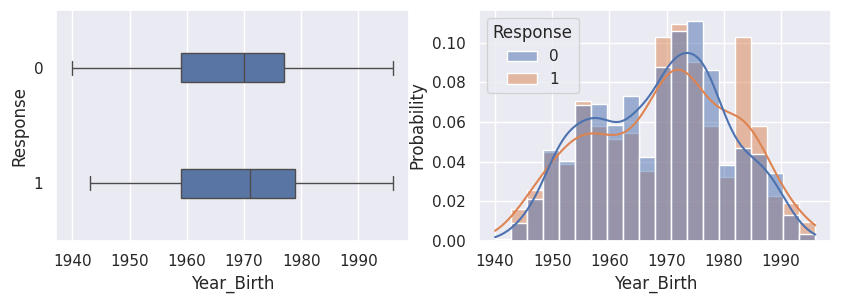
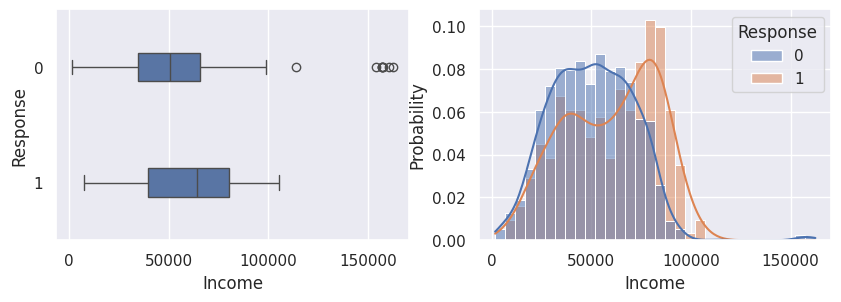
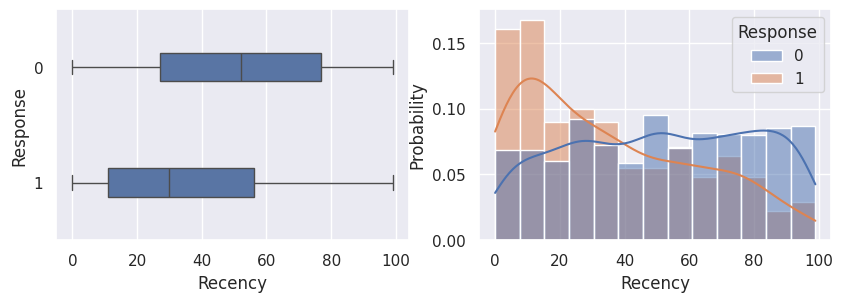
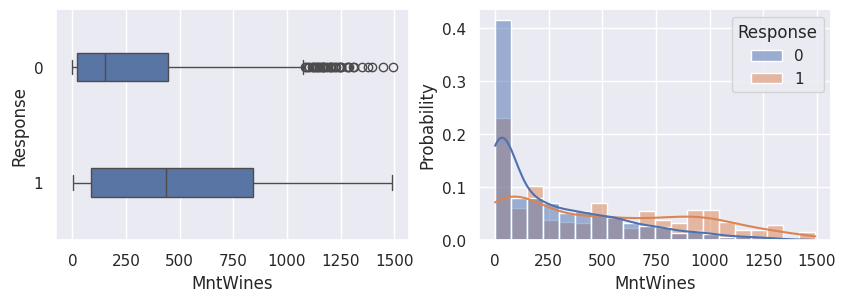
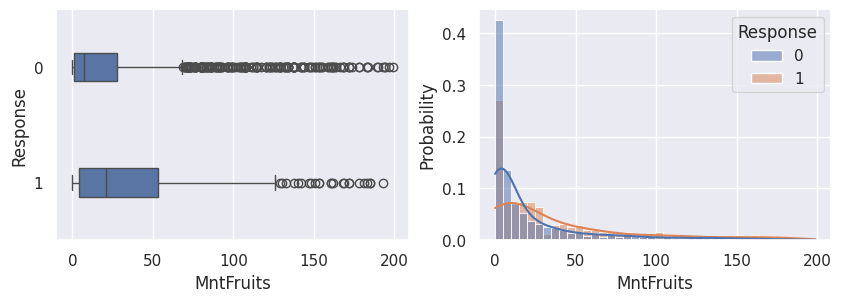
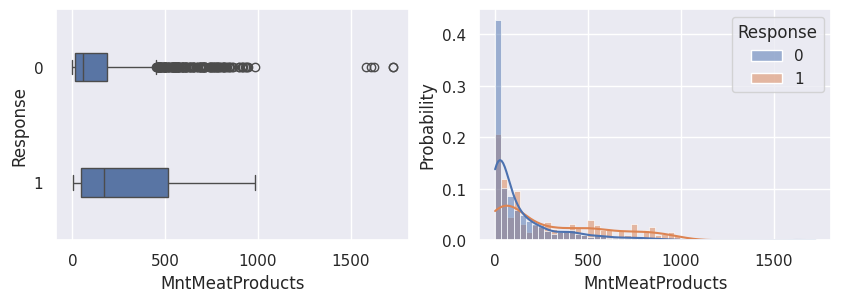
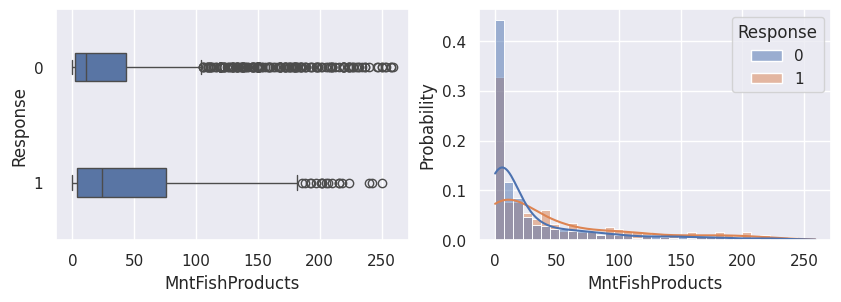
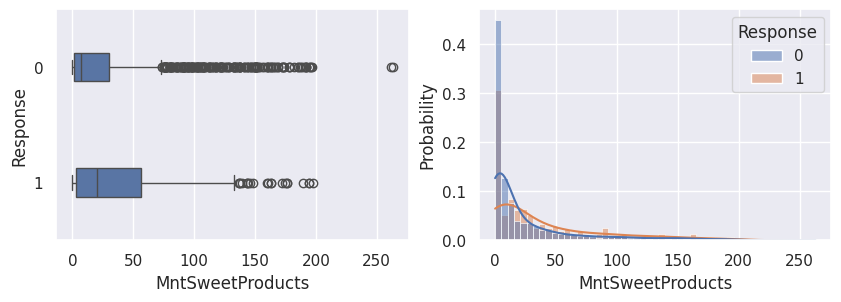
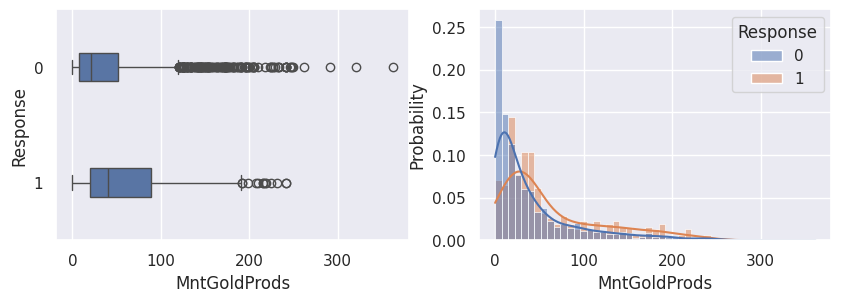
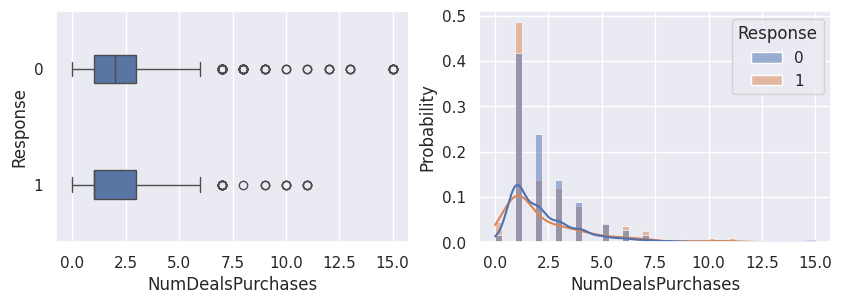
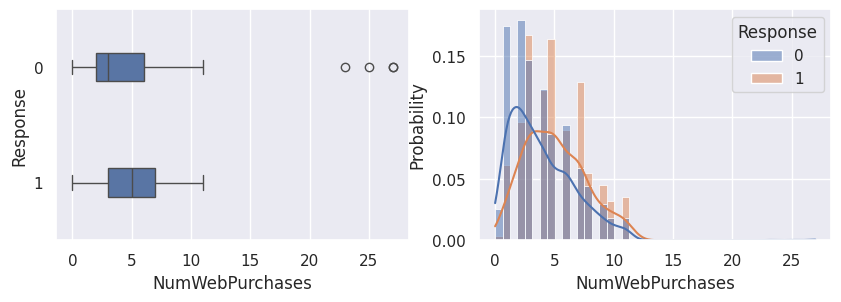
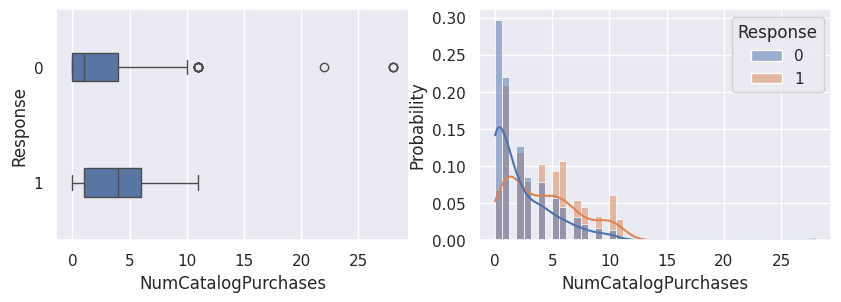
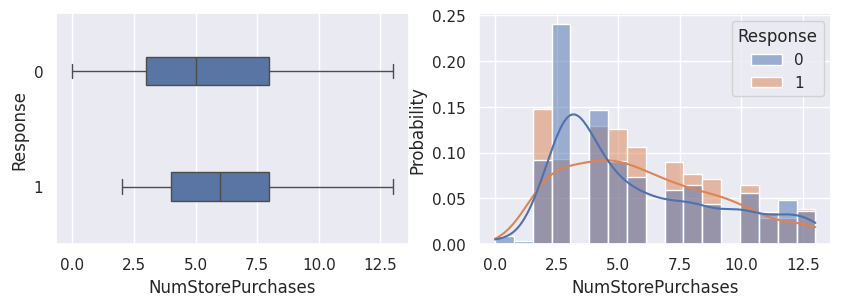
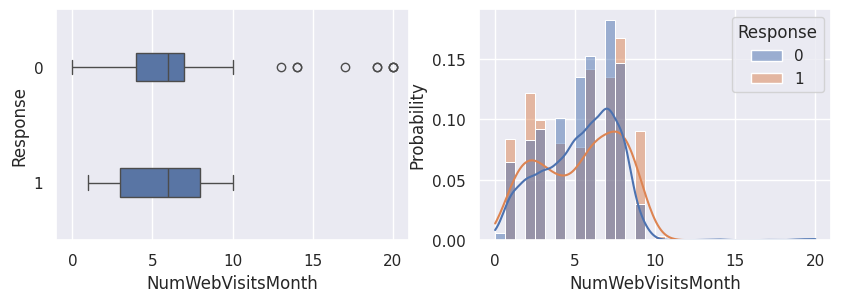
 1for var in var_numeriques:
 2    _, ax = plt.subplots(1, 2, figsize=(10, 3))
 3    sns.boxplot(df, x=df[var], y=df["Response"], width=0.25, ax=ax[0])
 4    sns.histplot(
 5        df,
 6        x=df[var],
 7        kde=True,
 8        ax=ax[1],
 9        hue=df["Response"],
10        stat="probability",
11        common_norm=False,
12    )
13    plt.show()
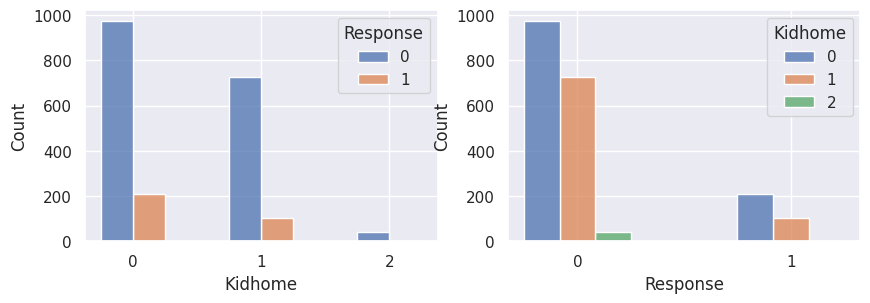
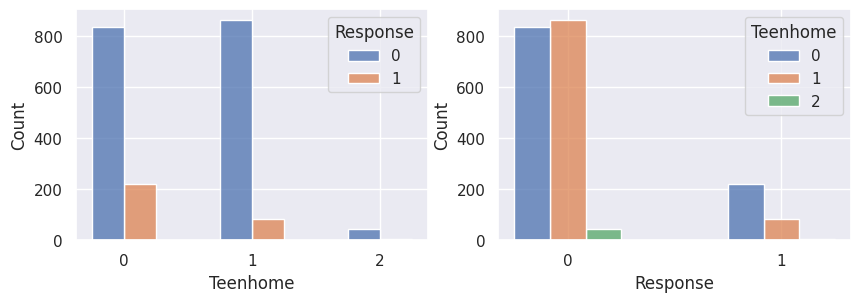
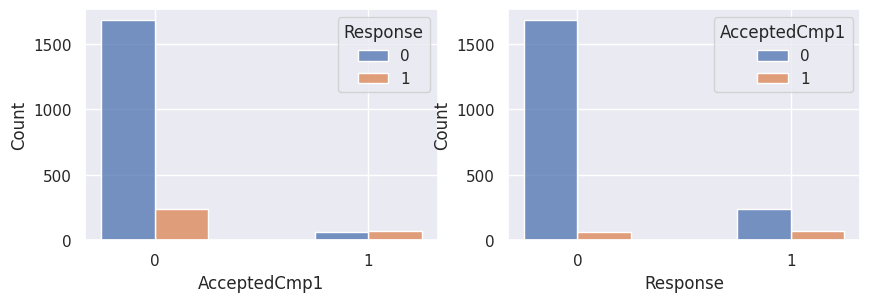
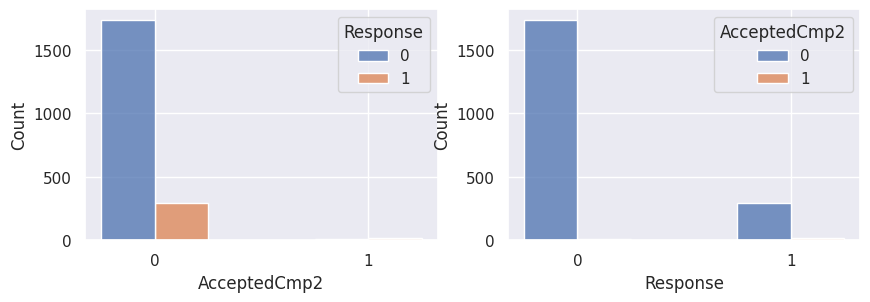
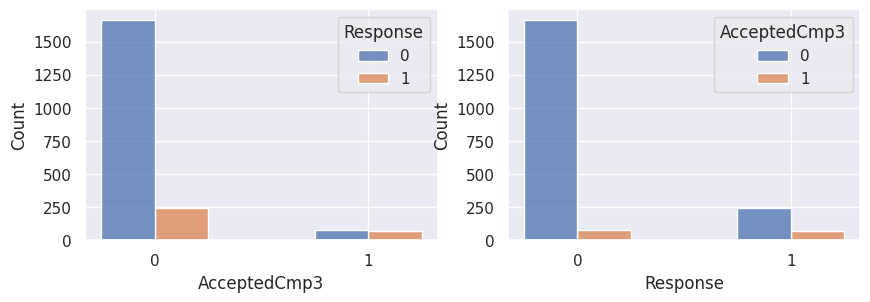
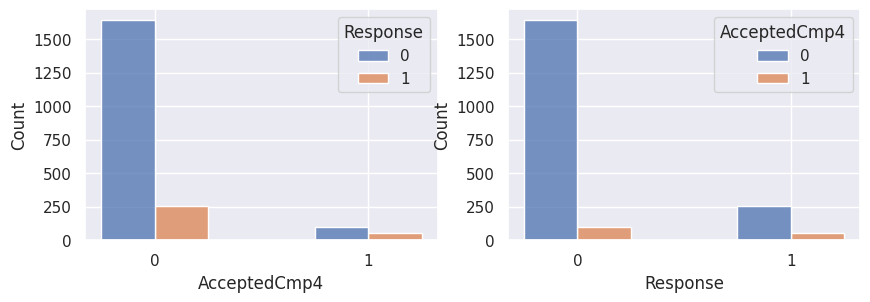
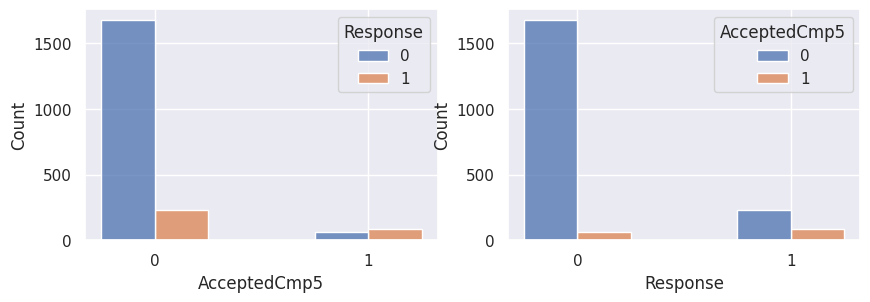
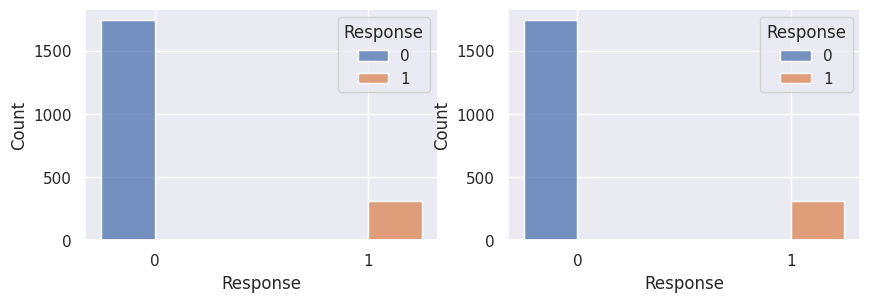
 1for var in var_categoriques_fe:
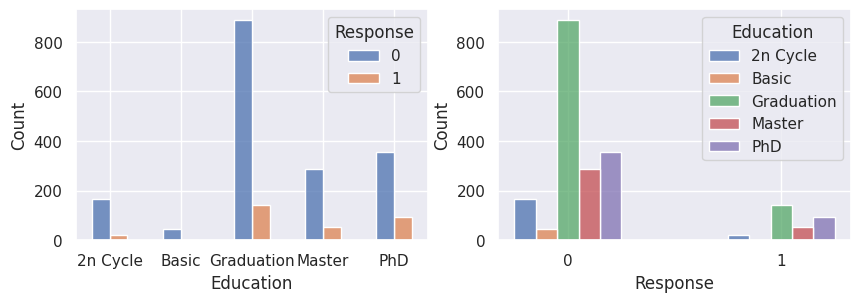
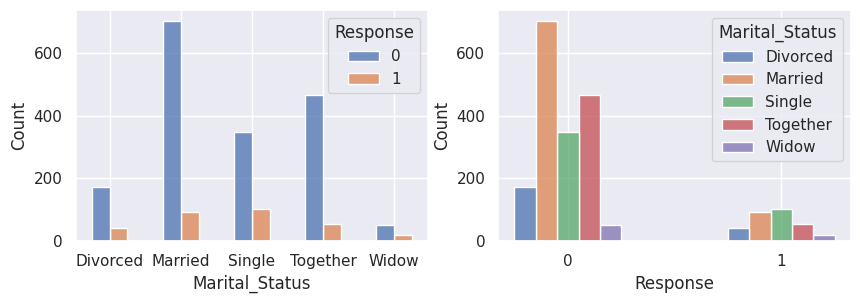
 2    _, ax = plt.subplots(1, 2, figsize=(10, 3))
 3
 4    sns.histplot(
 5        df,
 6        x=df[var],
 7        hue=df["Response"],
 8        multiple="dodge",
 9        shrink=0.5,
10        ax=ax[0],
11    )
12    sns.histplot(
13        df,
14        hue=df[var],
15        x=df["Response"],
16        multiple="dodge",
17        shrink=0.5,
18        ax=ax[1],
19    )
20
21    plt.show()
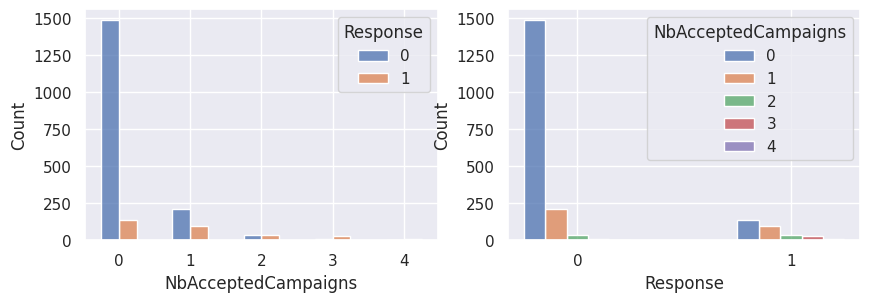
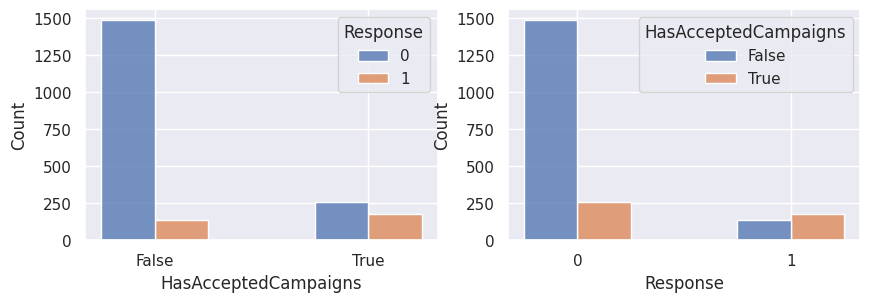
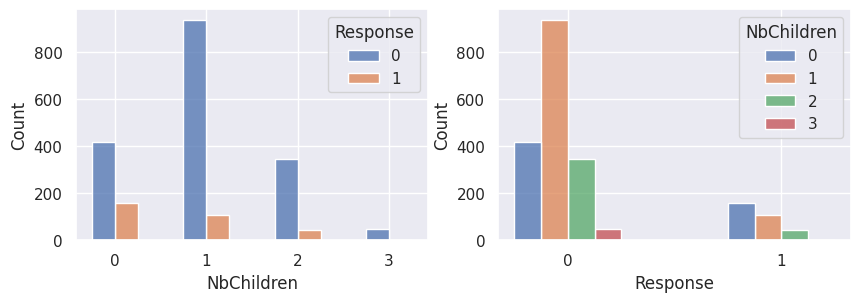
Graphiques supplémentaires#
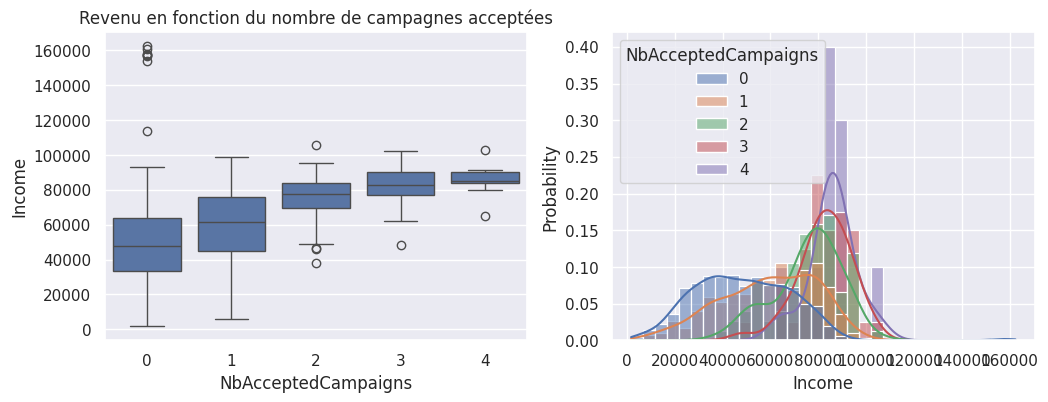
 1_, ax = plt.subplots(1, 2, figsize=(12, 4))
 2
 3ax[0].set_title("Revenu en fonction du nombre de campagnes acceptées")
 4
 5sns.boxplot(y=df["Income"], x=df["NbAcceptedCampaigns"], ax=ax[0])
 6sns.histplot(
 7    df,
 8    x="Income",
 9    hue="NbAcceptedCampaigns",
10    kde=True,
11    stat="probability",
12    common_norm=False,
13    ax=ax[1],
14)
<Axes: xlabel='Income', ylabel='Probability'>
 1_, ax = plt.subplots(1, 2, figsize=(12, 4))
 2
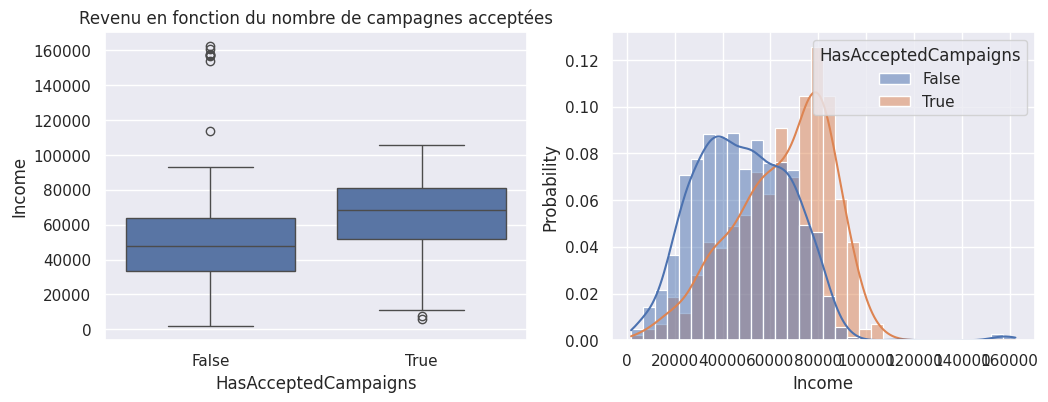
 3ax[0].set_title("Revenu en fonction du nombre de campagnes acceptées")
 4
 5sns.boxplot(y=df["Income"], x=df["HasAcceptedCampaigns"], ax=ax[0])
 6sns.histplot(
 7    df,
 8    x="Income",
 9    hue="HasAcceptedCampaigns",
10    kde=True,
11    stat="probability",
12    common_norm=False,
13    ax=ax[1],
14)
<Axes: xlabel='Income', ylabel='Probability'>
todo#
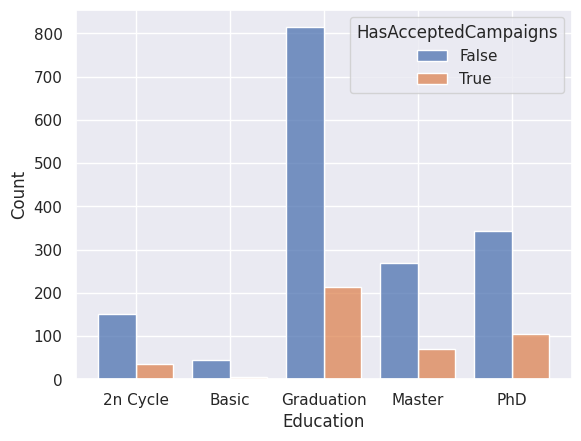
1sns.histplot(
2    data=df, x="Education", hue="HasAcceptedCampaigns", multiple="dodge", shrink=0.8
3)
<Axes: xlabel='Education', ylabel='Count'>
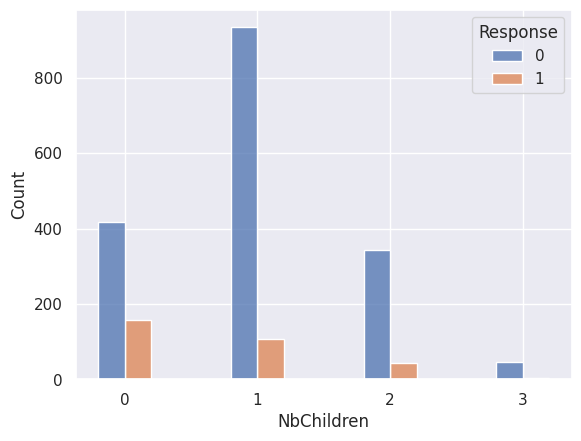
1sns.histplot(
2    data=df,
3    x="NbChildren",
4    hue="Response",
5    multiple="dodge",
6    discrete=True,
7    shrink=0.4,
8)
<Axes: xlabel='NbChildren', ylabel='Count'>
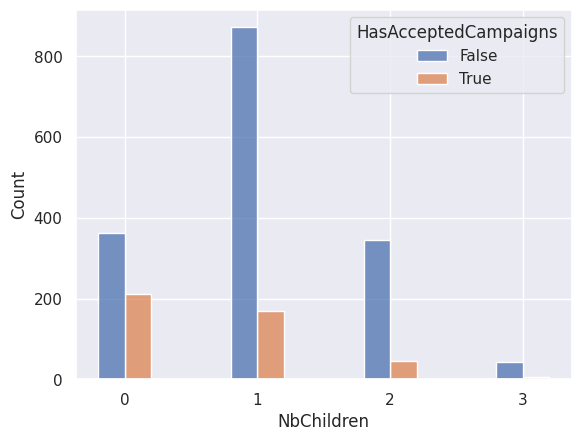
1sns.histplot(
2    data=df,
3    x="NbChildren",
4    hue="HasAcceptedCampaigns",
5    multiple="dodge",
6    discrete=True,
7    shrink=0.4,
8)
<Axes: xlabel='NbChildren', ylabel='Count'>
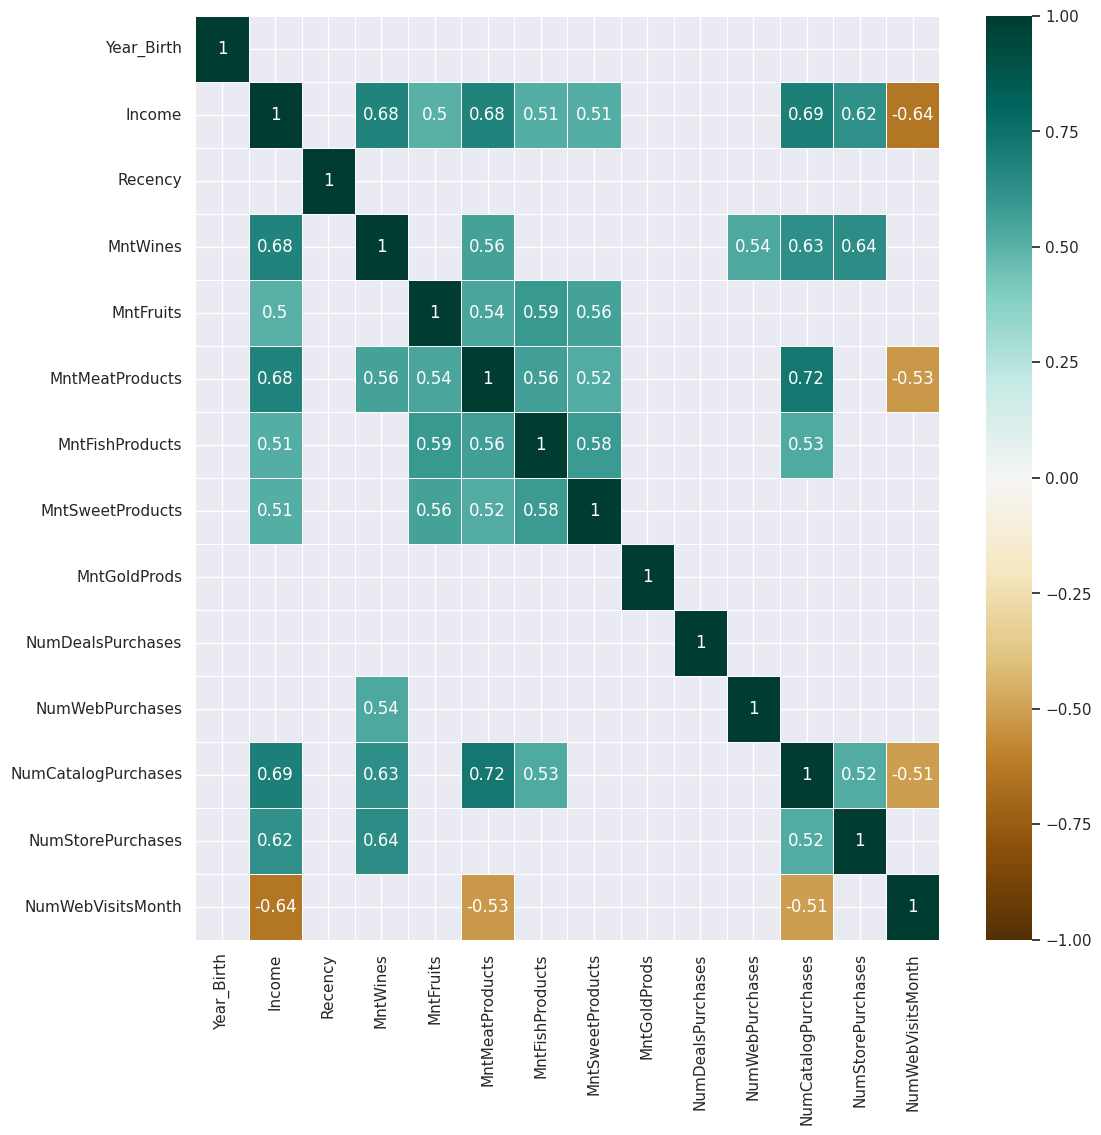
Matrice de corrélation#
1plt.figure(figsize=(12, 12))
2sns.heatmap(
3    df.corr()[df.corr().abs() > 0.5],
4    annot=True,
5    cmap="BrBG",
6    linewidths=0.5,
7    vmax=1,
8    vmin=-1,
9)
/tmp/ipykernel_2065/1235220098.py:3: FutureWarning: The default value of numeric_only in DataFrame.corr is deprecated. In a future version, it will default to False. Select only valid columns or specify the value of numeric_only to silence this warning.
  df.corr()[df.corr().abs() > 0.5],
<Axes: >
todo#
1## Exemple de graphique sur plusieurs colonnes
2## sns.displot(
3#     data=df,
4#     x="Marital_Status",
5#     hue="Response",
6#     col="Kidhome",
7#     multiple="dodge",
8#     shrink=0.8,
9## )