Régression supervisée#
Import des outils / jeu de données#
 1import matplotlib.pyplot as plt
 2import pandas as pd
 3import seaborn as sns
 4import statsmodels.api as sm
 5from sklearn.ensemble import RandomForestRegressor
 6from sklearn.linear_model import LinearRegression
 7from sklearn.metrics import mean_absolute_error, mean_squared_error, accuracy_score
 8from sklearn.model_selection import train_test_split
 9
10from src.utils import init_notebook
11from sklearn.linear_model import LogisticRegression
1init_notebook()
1df = pd.read_csv(
2    "data/kickstarter_1.csv",
3    parse_dates=True,
4)
5event_times = df["day_succ"]
6event_observed = df["Status"]
7
8event_times_no_censoring = df["day_succ"][df["Status"] == 1]
9event_observed_no_censoring = df["Status"][df["Status"] == 1]
On ne s’intéresse qu’aux variables suivantes
 1df = df[
 2    [
 3        "day_succ",
 4        "Status",
 5        "has_video",
 6        "facebook_connected",
 7        "goal",
 8        "facebook_friends",
 9    ]
10]
Régression logistique#
Nous cherchons à prévoir si le projet sera financé dans les 60 jours impartis ou non.
1X = df.drop(["day_succ", "Status"], axis=1)
2y = event_observed
1X_train, X_test, y_train, y_test = train_test_split(
2    X, y, test_size=0.2, random_state=42
3)
1log_reg = LogisticRegression()
2log_reg.fit(X_train, y_train)
3y_pred = log_reg.predict(X_test)
1accuracy = accuracy_score(y_test, y_pred)
2accuracy
0.629940119760479
Nous obtenons une accuracy de 62%, ce qui est relativement peu.
1# Get coefficients
2log_reg_coeff = pd.DataFrame(
3    {"Variable": [col for col in X.columns], "Coefficient": log_reg.coef_[0].tolist()}
4)
5log_reg_coeff
| Variable | Coefficient | |
|---|---|---|
| 0 | has_video | 0.848165 |
| 1 | facebook_connected | -0.009586 |
| 2 | goal | -6.582300 |
| 3 | facebook_friends | 0.366086 |
Régression linéaire#
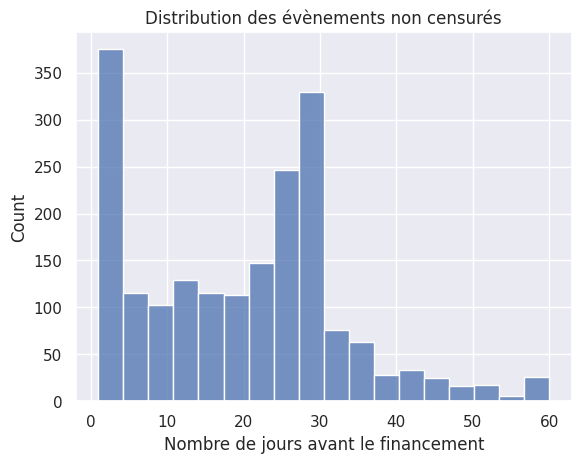
Nous cherchons à déterminer quelle est la durée de financement d’un projet, sachant qu’il a été financé.
1# Redefine variables
2X = df[event_observed == 1].drop(["Status", "day_succ"], axis=1)
3y = df["day_succ"][event_observed == 1]
1sns.histplot(y)
2plt.title("Distribution des évènements non censurés")
3plt.xlabel("Nombre de jours avant le financement")
Text(0.5, 0, 'Nombre de jours avant le financement')

Modèle explicatif#
 1# Add constant
 2X = sm.add_constant(X)
 3
 4# Define and fit model
 5linear_explic = sm.OLS(y, X).fit()
 6
 7# Predict
 8y_pred_explic = linear_explic.predict(X)
 9
10# Calculate residuals
11residuals_explic = y_pred_explic - y
Diagnostic#
1linear_explic.summary()
| Dep. Variable: | day_succ | R-squared: | 0.017 |
|---|---|---|---|
| Model: | OLS | Adj. R-squared: | 0.015 |
| Method: | Least Squares | F-statistic: | 8.626 |
| Date: | Mon, 15 Jan 2024 | Prob (F-statistic): | 6.71e-07 |
| Time: | 23:44:53 | Log-Likelihood: | -7852.4 |
| No. Observations: | 1962 | AIC: | 1.571e+04 |
| Df Residuals: | 1957 | BIC: | 1.574e+04 |
| Df Model: | 4 | ||
| Covariance Type: | nonrobust |
| coef | std err | t | P>|t| | [0.025 | 0.975] | |
|---|---|---|---|---|---|---|
| const | 17.1439 | 1.006 | 17.048 | 0.000 | 15.172 | 19.116 |
| has_video | 2.5783 | 0.904 | 2.853 | 0.004 | 0.806 | 4.351 |
| facebook_connected | 1.2968 | 0.670 | 1.936 | 0.053 | -0.017 | 2.610 |
| goal | 32.5965 | 10.546 | 3.091 | 0.002 | 11.914 | 53.279 |
| facebook_friends | 0.8303 | 0.311 | 2.670 | 0.008 | 0.220 | 1.440 |
| Omnibus: | 44.454 | Durbin-Watson: | 0.034 |
|---|---|---|---|
| Prob(Omnibus): | 0.000 | Jarque-Bera (JB): | 46.567 |
| Skew: | 0.367 | Prob(JB): | 7.73e-11 |
| Kurtosis: | 2.827 | Cond. No. | 56.2 |
Notes:
[1] Standard Errors assume that the covariance matrix of the errors is correctly specified.
Un objectif financier (
goal) ambitieux signifie plus de temps avant d’atteindre le financement. C’est la variable la plus influente.Avoir une vidéo pour promouvoir le projet est très favorable.
Plus le compte facebook du projet a d’abonnés, plus la durée de financement est courte.
facebook_connectedengendre un problème de multicolinéarité avecfacebook_friendset n’est donc pas significative. On la retire de l’analyse.
1# Drop variable
2X = X.drop("facebook_connected", axis=1)
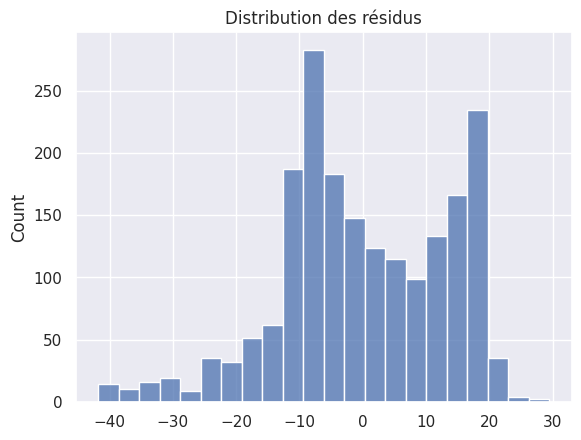
1sns.histplot(residuals_explic)
2plt.title("Distribution des résidus")
Text(0.5, 1.0, 'Distribution des résidus')

Modèle prédictif#
1X_train, X_test, y_train, y_test = train_test_split(
2    X, y, test_size=0.2, random_state=42
3)
1linear = LinearRegression(fit_intercept=False)
2linear.fit(X_train, y_train)
LinearRegression(fit_intercept=False)In a Jupyter environment, please rerun this cell to show the HTML representation or trust the notebook.
On GitHub, the HTML representation is unable to render, please try loading this page with nbviewer.org.
LinearRegression(fit_intercept=False)
1# Get coefficients
2coefficients_df = pd.DataFrame(
3    {"Variable": [col for col in X.columns], "Coefficient": linear.coef_.tolist()}
4)
5coefficients_df
| Variable | Coefficient | |
|---|---|---|
| 0 | const | 17.190159 |
| 1 | has_video | 3.026888 |
| 2 | goal | 19.910159 |
| 3 | facebook_friends | 1.212761 |
1# Evaluate model prediction capacity
2y_pred = linear.predict(X_test)
3
4linear_mse = mean_squared_error(y_true=y_test, y_pred=y_pred)
5linear_mae = mean_absolute_error(y_true=y_test, y_pred=y_pred)
6
7print(f"Mean squared error = {round(linear_mse)}")
8print(f"Mean absolute error = {round(linear_mae)}")
Mean squared error = 188
Mean absolute error = 12
En moyenne, le modèle de régression linéaire parvient à prévoir la durée nécessaire au financement à 12 jours près.
Forêt aléatoire#
1# Create and train a Random Forest Regressor
2random_forest = RandomForestRegressor(n_estimators=100, random_state=42)
3random_forest.fit(X_train, y_train)
RandomForestRegressor(random_state=42)In a Jupyter environment, please rerun this cell to show the HTML representation or trust the notebook.
On GitHub, the HTML representation is unable to render, please try loading this page with nbviewer.org.
RandomForestRegressor(random_state=42)
1# Get feature importances
2feature_importances = random_forest.feature_importances_
3
4# Display feature importances
5importances_df = pd.DataFrame(
6    {"Variable": [col for col in X.columns], "Importance": feature_importances.tolist()}
7)
8importances_df
| Variable | Importance | |
|---|---|---|
| 0 | const | 0.000000 |
| 1 | has_video | 0.033123 |
| 2 | goal | 0.415424 |
| 3 | facebook_friends | 0.551453 |
1# Evaluate model prediction capacity
2y_pred_rf = random_forest.predict(X_test)
3
4# Calculate Mean Squared Error and Mean Absolute Error
5rf_mse = mean_squared_error(y_true=y_test, y_pred=y_pred_rf)
6rf_mae = mean_absolute_error(y_true=y_test, y_pred=y_pred_rf)
7
8print(f"Random Forest Mean Squared Error = {round(rf_mse)}")
9print(f"Random Forest Mean Absolute Error = {round(rf_mae)}")
Random Forest Mean Squared Error = 211
Random Forest Mean Absolute Error = 11
En moyenne, le modèle de forêt aléatoire parvient à prévoir la durée nécessaire au financement à 11 jours près.
Réseau de neurones#
1from sklearn.neural_network import MLPRegressor
2from sklearn.metrics import mean_squared_error, mean_absolute_error
 1# Create and train a Multi-layer Perceptron Regressor
 2mlp_regressor = MLPRegressor(hidden_layer_sizes=(64, 32), max_iter=1000, random_state=42)
 3mlp_regressor.fit(X_train, y_train)
 4
 5# Evaluate model prediction capacity
 6y_pred_mlp = mlp_regressor.predict(X_test)
 7
 8# Calculate Mean Squared Error and Mean Absolute Error
 9mlp_mse = mean_squared_error(y_true=y_test, y_pred=y_pred_mlp)
10mlp_mae = mean_absolute_error(y_true=y_test, y_pred=y_pred_mlp)
11
12print(f"MLP Regressor Mean Squared Error = {round(mlp_mse)}")
13print(f"MLP Regressor Mean Absolute Error = {round(mlp_mae)}")
MLP Regressor Mean Squared Error = 190
MLP Regressor Mean Absolute Error = 12
En moyenne, le réseau de neurones parvient à prévoir la durée nécessaire au financement à 12 jours près.
Bilan#
Régression logistique |
Accuracy |
|---|---|
Le projet sera-t-il financé ? |
62% |
Tableau. Modèle de prévision et MAE correspondante obtenue sur l’ensemble de test
Modèle |
MAE |
|---|---|
Régression Linéaire |
12 jours |
Forêt Aléatoire |
11 jours |
Réseau de Neurones |
12 jours |
On conservera donc le modèle de forêt aléatoire pour la prédiction.