Régression non-paramétrique#
Objectif
vérifier l’hypothèse de hazard proportionnel
régression non-paramétrique et paramétrique
choisir le meilleur modèle pour chaque
Tableau. Notre démarche pour les régressions non-paramétriques.
Régressions non-paramétriques testées |
Critère de sélection |
|---|---|
- Cox proportionnel |
- indice de concordance |
- Aalen additif |
- MAE de prédiction (cross-validée) |
- Aalen additif avec pénalité (hyper-paramètre) |
Tableau. Notre démarche pour les régressions paramétriques.
Régressions paramétriques testées |
Critère de sélection |
|---|---|
- Weibull AFT |
- AIC |
- Exponentiel par morceaux (3 morceaux) |
- BIC |
- Exponentiel par morceaux (5 morceaux) |
- MAE de prédiction (cross-validée) |
 1import numpy as np
 2import pandas as pd
 3from lifelines import *
 4from lifelines import (
 5    AalenAdditiveFitter,
 6    CoxPHFitter,
 7    LogNormalAFTFitter,
 8    PiecewiseExponentialRegressionFitter,
 9    WeibullAFTFitter,
10    WeibullFitter,
11)
12from lifelines.plotting import qq_plot
13from lifelines.utils import find_best_parametric_model, k_fold_cross_validation
14from matplotlib import pyplot as plt
15from sklearn.metrics import mean_absolute_error
16
17from src.utils import init_notebook
1init_notebook()
Données#
1df = pd.read_csv(
2    "data/kickstarter_1.csv",
3    parse_dates=True,
4)
 1df = df[
 2    [
 3        "day_succ",
 4        "Status",
 5        "has_video",
 6        "facebook_connected",
 7        "goal",
 8        "facebook_friends",
 9    ]
10]
1event_times = df["day_succ"]
2event_observed = df["Status"]
1cph = CoxPHFitter()
2cph.fit(df, duration_col="day_succ", event_col="Status")
<lifelines.CoxPHFitter: fitted with 4175 total observations, 2213 right-censored observations>
Vérification du hazard proportionnel#
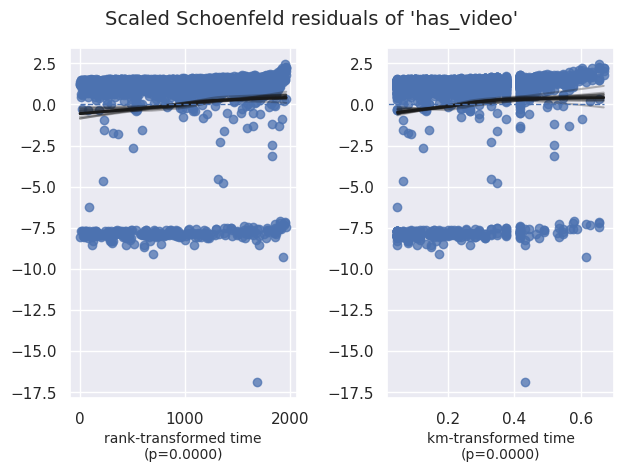
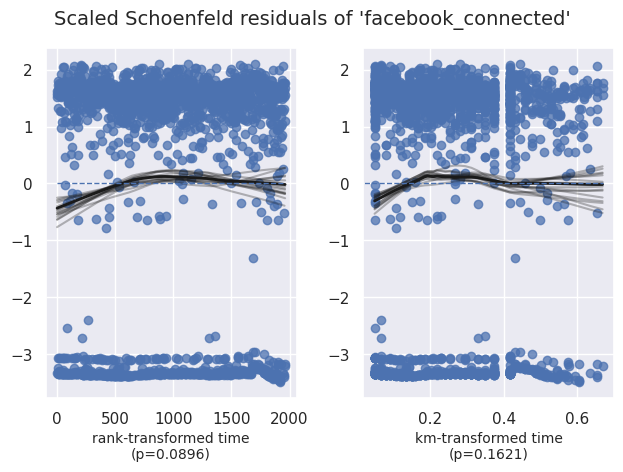
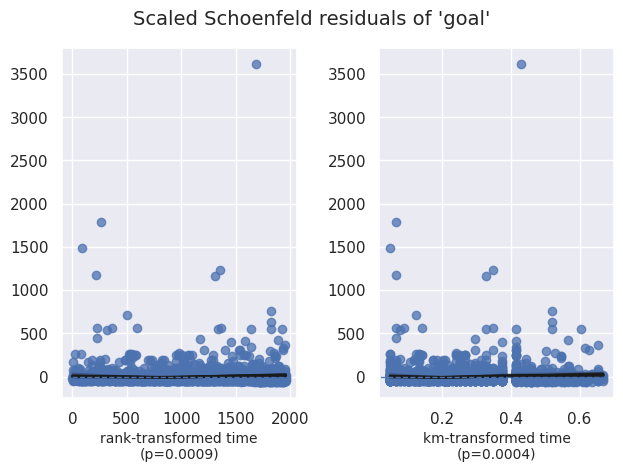
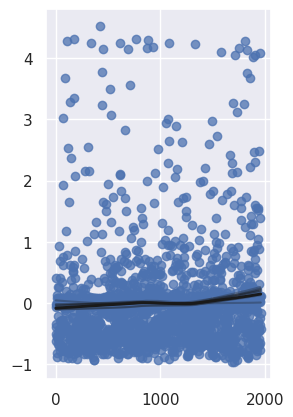
1cph.check_assumptions(df, show_plots=True)
Bootstrapping lowess lines. May take a moment...
The ``p_value_threshold`` is set at 0.01. Even under the null hypothesis of no violations, some
covariates will be below the threshold by chance. This is compounded when there are many covariates.
Similarly, when there are lots of observations, even minor deviances from the proportional hazard
assumption will be flagged.

With that in mind, it's best to use a combination of statistical tests and visual tests to determine
the most serious violations. Produce visual plots using ``check_assumptions(..., show_plots=True)``
and looking for non-constant lines. See link [A] below for a full example.
| null_distribution | chi squared |
|---|---|
| degrees_of_freedom | 1 |
| model | <lifelines.CoxPHFitter: fitted with 4175 total... |
| test_name | proportional_hazard_test |
| test_statistic | p | -log2(p) | ||
|---|---|---|---|---|
| facebook_connected | km | 1.95 | 0.16 | 2.63 |
| rank | 2.88 | 0.09 | 3.48 | |
| facebook_friends | km | 7.22 | 0.01 | 7.12 |
| rank | 5.95 | 0.01 | 6.08 | |
| goal | km | 12.49 | <0.005 | 11.26 |
| rank | 10.95 | <0.005 | 10.06 | |
| has_video | km | 19.02 | <0.005 | 16.24 |
| rank | 20.93 | <0.005 | 17.68 |
1. Variable 'has_video' failed the non-proportional test: p-value is <5e-05.

   Advice: with so few unique values (only 2), you can include `strata=['has_video', ...]` in the
call in `.fit`. See documentation in link [E] below.

   Bootstrapping lowess lines. May take a moment...
Bootstrapping lowess lines. May take a moment...
2. Variable 'goal' failed the non-proportional test: p-value is 0.0004.

   Advice 1: the functional form of the variable 'goal' might be incorrect. That is, there may be
non-linear terms missing. The proportional hazard test used is very sensitive to incorrect
functional forms. See documentation in link [D] below on how to specify a functional form.

   Advice 2: try binning the variable 'goal' using pd.cut, and then specify it in `strata=['goal',
...]` in the call in `.fit`. See documentation in link [B] below.

   Advice 3: try adding an interaction term with your time variable. See documentation in link [C]
below.


   Bootstrapping lowess lines. May take a moment...
---------------------------------------------------------------------------
KeyboardInterrupt                         Traceback (most recent call last)
Cell In[7], line 1
----> 1 cph.check_assumptions(df, show_plots=True)

File ~/.cache/pypoetry/virtualenvs/kickstarter-project-analysis-8mQTRXZa-py3.10/lib/python3.10/site-packages/lifelines/fitters/mixins.py:139, in ProportionalHazardMixin.check_assumptions(self, training_df, advice, show_plots, p_value_threshold, plot_n_bootstraps, columns)
    137     ix = sorted(np.random.choice(n, n))
    138     tt_ = tt.values[ix]
--> 139     y_lowess = lowess(tt_, y.values[ix])
    140     ax.plot(tt_, y_lowess, color="k", alpha=0.30)
    142 best_xlim = ax.get_xlim()

File ~/.cache/pypoetry/virtualenvs/kickstarter-project-analysis-8mQTRXZa-py3.10/lib/python3.10/site-packages/lifelines/utils/lowess.py:49, in lowess(x, y, f, iterations)
     47 for i in range(n):
     48     weights = delta * w[:, i]
---> 49     b = np.array([np.sum(weights * y), np.sum(weights * y * x)])
     50     A = np.array([[np.sum(weights), np.sum(weights * x)], [np.sum(weights * x), np.sum(weights * x * x)]])
     51     # I think it is safe to assume this.
     52     # pylint: disable=unexpected-keyword-arg

File ~/.cache/pypoetry/virtualenvs/kickstarter-project-analysis-8mQTRXZa-py3.10/lib/python3.10/site-packages/numpy/core/fromnumeric.py:2313, in sum(a, axis, dtype, out, keepdims, initial, where)
   2310         return out
   2311     return res
-> 2313 return _wrapreduction(a, np.add, 'sum', axis, dtype, out, keepdims=keepdims,
   2314                       initial=initial, where=where)

File ~/.cache/pypoetry/virtualenvs/kickstarter-project-analysis-8mQTRXZa-py3.10/lib/python3.10/site-packages/numpy/core/fromnumeric.py:88, in _wrapreduction(obj, ufunc, method, axis, dtype, out, **kwargs)
     85         else:
     86             return reduction(axis=axis, out=out, **passkwargs)
---> 88 return ufunc.reduce(obj, axis, dtype, out, **passkwargs)

KeyboardInterrupt:
Modèles non-paramétrique#
Modèle de Cox#
1cph.print_summary()
| model | lifelines.CoxPHFitter |
|---|---|
| duration col | 'day_succ' |
| event col | 'Status' |
| baseline estimation | breslow |
| number of observations | 3340 |
| number of events observed | 1569 |
| partial log-likelihood | -11708.02 |
| time fit was run | 2024-01-15 23:19:26 UTC |
| coef | exp(coef) | se(coef) | coef lower 95% | coef upper 95% | exp(coef) lower 95% | exp(coef) upper 95% | cmp to | z | p | -log2(p) | |
|---|---|---|---|---|---|---|---|---|---|---|---|
| has_video | 0.77 | 2.15 | 0.08 | 0.61 | 0.92 | 1.84 | 2.51 | 0.00 | 9.72 | <0.005 | 71.73 |
| facebook_connected | -0.04 | 0.96 | 0.06 | -0.15 | 0.07 | 0.86 | 1.08 | 0.00 | -0.64 | 0.52 | 0.94 |
| goal | -21.28 | 0.00 | 1.74 | -24.70 | -17.87 | 0.00 | 0.00 | 0.00 | -12.21 | <0.005 | 111.42 |
| facebook_friends | 0.15 | 1.16 | 0.02 | 0.11 | 0.20 | 1.11 | 1.22 | 0.00 | 6.73 | <0.005 | 35.79 |
| Concordance | 0.66 |
|---|---|
| Partial AIC | 23424.05 |
| log-likelihood ratio test | 409.37 on 4 df |
| -log2(p) of ll-ratio test | 287.61 |
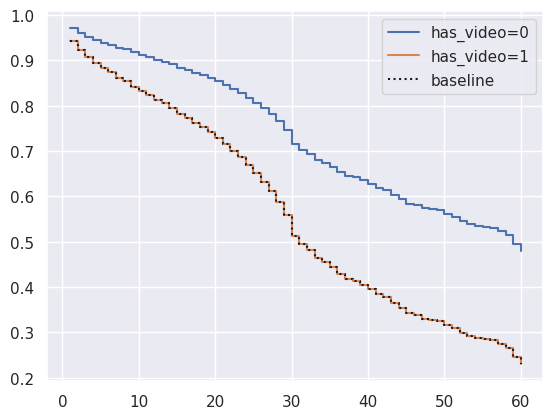
1cph.plot_partial_effects_on_outcome(covariates="has_video", values=[0, 1])
<Axes: >
Cross-validation (Cox & Aalen additif)#
1# create the three models we'd like to compare.
2aaf_1 = AalenAdditiveFitter(coef_penalizer=0)
3aaf_2 = AalenAdditiveFitter(coef_penalizer=10)
4cph = CoxPHFitter()
 1def moyenne_cross_val(model, df: pd.DataFrame):
 2    return np.mean(
 3        k_fold_cross_validation(
 4            model,
 5            df,
 6            duration_col="day_succ",
 7            event_col="Status",
 8            scoring_method="concordance_index",
 9        )
10    )
 1models_list = {
 2    "Cox proportionnel": cph,
 3    "Aalen Additive (sans pénalité)": aaf_1,
 4    "Aalen Additive (pénalité 10)": aaf_2,
 5}
 6
 7cox_tab = {
 8    "Modèle": [],
 9    "Indice de concordance": [],
10}  # todo: rename
11
12for model in models_list.keys():
13    m = models_list[model]
14    moy = moyenne_cross_val(m, df)
15
16    cox_tab["Modèle"].append(model)
17    cox_tab["Indice de concordance"].append(moy)
1# print(pd.DataFrame(cox_tab).to_markdown(index=False))
Tableau. Comparaison des modèles de régression non-paramétriques.
Modèle |
Indice de concordance |
|---|---|
Cox proportionnel |
0.656568 |
Aalen Additive (sans pénalité) |
0.586883 |
Aalen Additive (pénalité 10) |
0.588575 |
Interprétation :
indice de concordance > 0.5 => performance supérieure à du hasard
indice de concordance = 0.5 => performance équivalente à du hasard
indice de concordance < 0.5 => performance inférieure à du hasard
Choix : modèle de Cox proportionnel
Prédictions#
 1models_nonparam = {
 2    "Cox proportionnel": cph,
 3    "Aalen additif (sans pénalité)": aaf_1,
 4    "Aalen additif (avec pénalité=10)": aaf_2,
 5}
 6
 7models_param = {
 8    "Weibull AFT": WeibullAFTFitter(),
 9    "Exponentiel morceaux (3)": PiecewiseExponentialRegressionFitter(
10        breakpoints=[9, 21, 29]
11    ),
12    "Exponentiel morceaux (5)": PiecewiseExponentialRegressionFitter(
13        breakpoints=[10, 20, 30, 40, 50]
14    ),
15}
1res_models = {
2    "Modèle": [],
3    "AIC": [],
4    "BIC": [],
5    "MAE": [],
6}
 1for model_name in models_nonparam.keys():
 2    model = models_nonparam[model_name]
 3    model.fit(df, duration_col="day_succ", event_col="Status")
 4
 5    y_pred = model.predict_expectation(df)
 6    mae = mean_absolute_error(event_times, y_pred)
 7
 8    res_models["Modèle"].append(model_name)
 9    res_models["MAE"].append(mae)
10    res_models["AIC"].append(np.nan)
11    res_models["BIC"].append(np.nan)
 1for model_name in models_param.keys():
 2    model = models_param[model_name]
 3    model.fit(df, duration_col="day_succ", event_col="Status")
 4
 5    y_pred = model.predict_expectation(df)
 6    mae = mean_absolute_error(event_times, y_pred)
 7
 8    res_models["Modèle"].append(model_name)
 9    res_models["MAE"].append(mae)
10    res_models["AIC"].append(model.AIC_)
11    res_models["BIC"].append(model.BIC_)
/home/ab2/.cache/pypoetry/virtualenvs/kickstarter-project-analysis-ue2DmfIx-py3.10/lib/python3.10/site-packages/lifelines/fitters/__init__.py:2371: ApproximationWarning: Approximating using `predict_survival_function`. To increase accuracy, try using or increasing the resolution of the timeline kwarg in `.fit(..., timeline=timeline)`.
warnings.warn(
/home/ab2/.cache/pypoetry/virtualenvs/kickstarter-project-analysis-ue2DmfIx-py3.10/lib/python3.10/site-packages/lifelines/fitters/__init__.py:2507: ApproximationWarning: Approximating the expected value using trapezoid rule.
warnings.warn("""Approximating the expected value using trapezoid rule.\n""", exceptions.ApproximationWarning)
1# print(pd.DataFrame(res_models).to_markdown(index=False))
Tableau. Résultats des modèles de régression
Modèle |
AIC |
BIC |
MAE |
|---|---|---|---|
Cox proportionnel |
nan |
nan |
13.6055 |
Aalen additif (sans pénalité) |
nan |
nan |
13.9461 |
Aalen additif (avec pénalité=10) |
nan |
nan |
14.0145 |
Weibull AFT |
19465.7 |
19470.3 |
3.24738e+77 |
Exponentiel morceaux (3) |
19127.7 |
19121.1 |
13.0742 |
Exponentiel morceaux (5) |
19138.1 |
19128.1 |
13.2367 |
Meilleur modèle : exponentiel par morceaux (3)
Nos 3 meilleurs modèles de régression sont :
Exponenentiel morceaux (3)
Exponentiel morceaux (5)
Cox proportionnel